The UK is currently in the midst of political upheaval, with time-honoured party lines being redrawn and Brexit dividing generations and families. MPs are just as divided and struggling to agree on a way forward. With yet another delay to Brexit, and an election called for December 12, 2019, the hope for a fast resolution continues to drag on.
Pureprofile conducted a study, with over 1500 respondents, to uncover how UK voter preferences have changed in the three years since the 2016 referendum. In order to give further insights into potential age indicators that influence voting behaviours, we analysed the differences in responses across generations.
Brexit voting preferences
How have voting preferences changed in the last three years?
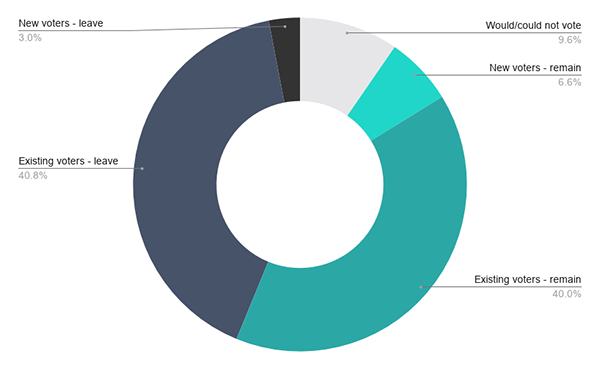
90% of survey respondents said they voted in the 2016 referendum – 18% higher than registered UK voters, according to The UK Electoral Commision, indicating that our sample are more politically active than average UK citizens.
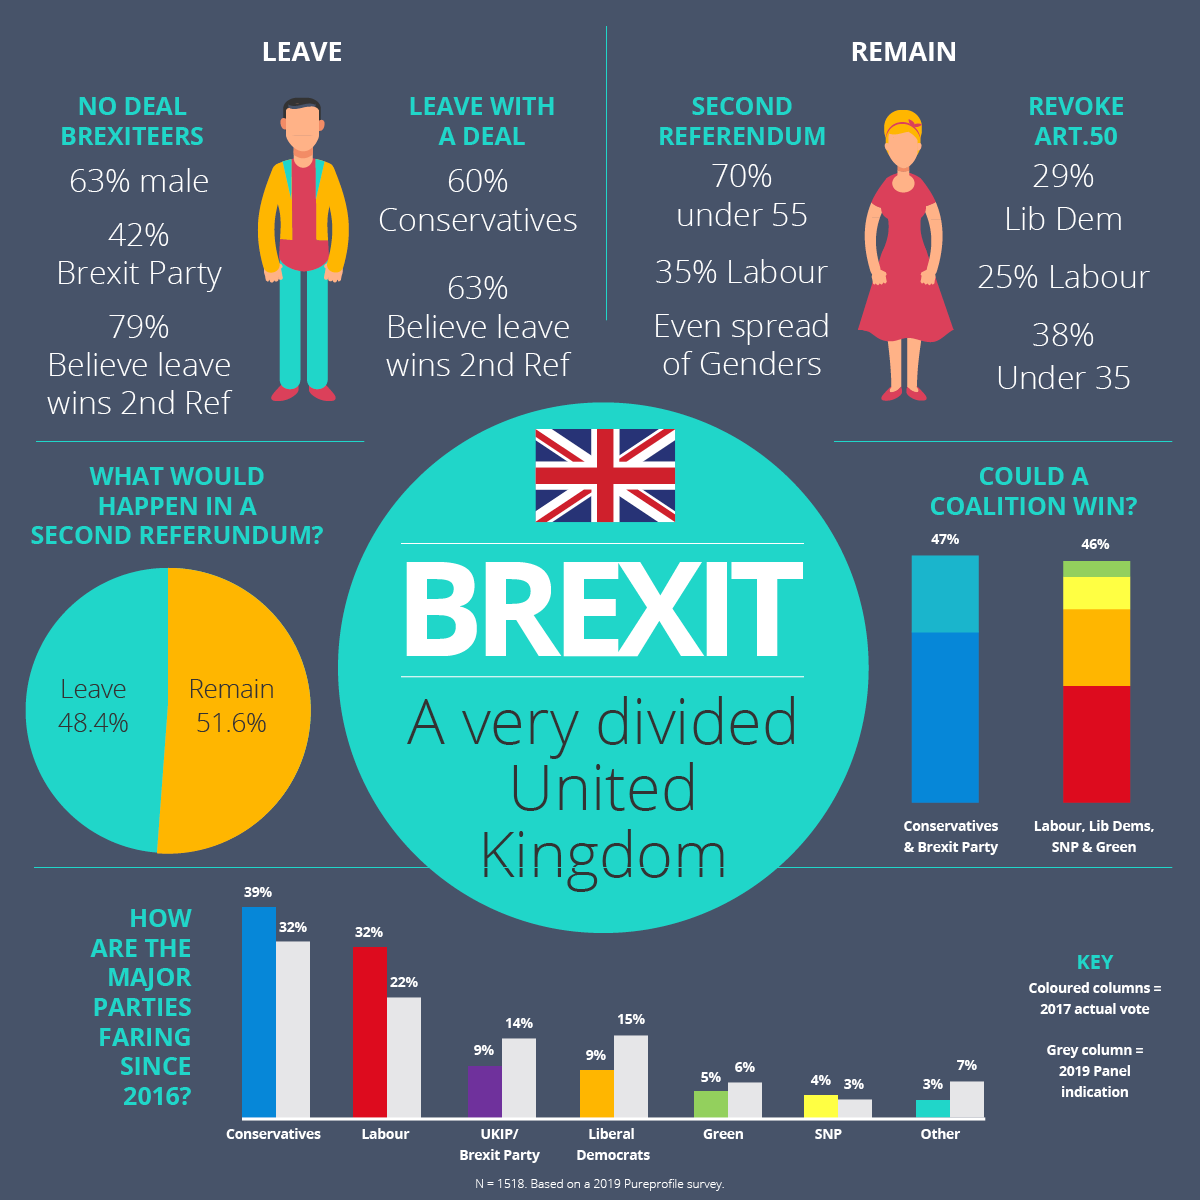
43% of respondents who chose not to vote in 2016, indicated that they would continue to withhold their vote in the case of a second referendum. Interestingly, many of those who were ineligible or too young to vote in 2016 would now vote to remain in the EU. As a result of these changes, the data suggests a second referendum could return a result of 51.6% Remain and 48.4% Leave.
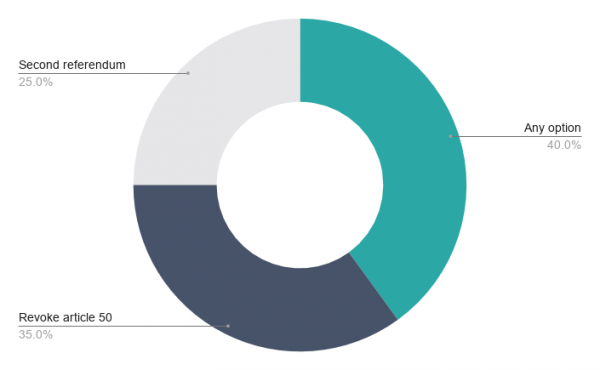
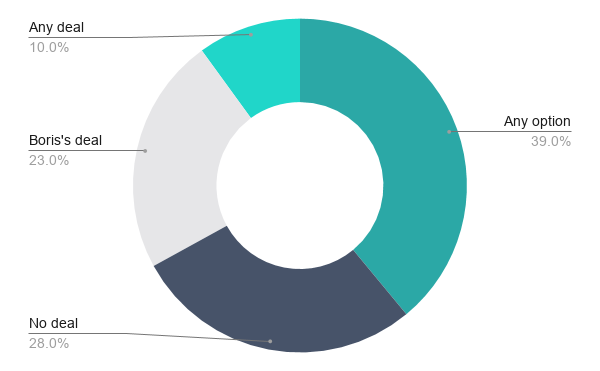
How do voters want to see Brexit resolved?
Leave voters:
Remain voters:
Election preferences
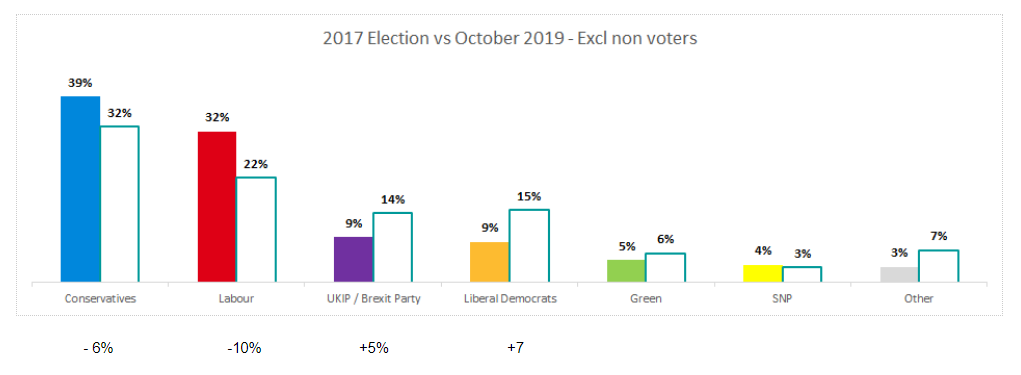
If an election were held tomorrow, which party would get your vote?
*Left columns represents the 2017 actual vote, right columns represent 2019 Pureprofile panel indication
Data suggests that the major parties are currently losing support, with large numbers of voters indicating they would support a more Brexit-polarised position; either the Brexit Party (pro-Leave) or the Liberal Democrats (pro-Remain).
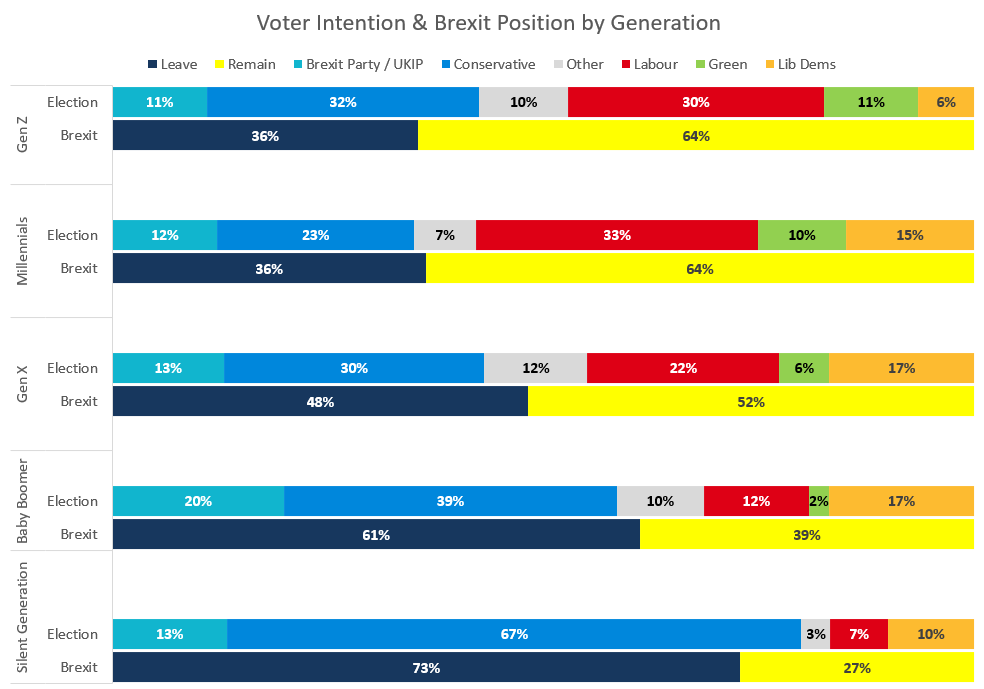
Generational differences in voter intentions
The analysis of voting preferences by generation revealed some striking differences. Gen Z, whilst having the highest ‘Remain’ preference, also indicated that they would vote for the Conservative or Labour parties. Support for the Liberal Democrats was steady across Millennials, Gen X and Baby Boomers. Finally, support for the Brexit Party peaked in the older generations.
| Silent Generation: (born before 1945) Baby Boomers: (born 1946-1960) Gen X (born 1961-1980) Millennials (born 1981-1995) Gen Z (born after 1995) |
Where to go from here?
Our analysis illustrates that public opinion is swinging slightly in favour of Remain. However, Brexit still remains an extremely divisive issue with neither camp coming close to achieving a majority.
The impact of voter intentions on the major political parties is substantial. Data suggests that the Labour Party may lose up to a third of supporters to the Liberal Democrats or to non-voters. Similarly, Conservatives may lose over 20% to either the Brexit Party or the Liberal Democrats.
While the figures showed a heavy skew for Remainers in the younger generations, these groups also showed the highest percentage (15%) of non-voters – almost double that of older generations, further fuelling the uncertainty of the outcome.
SHARE THIS INFOGRAPHIC ON YOUR SITE
