When comparing British voting trends from the 2019 election to the impending next general election, it becomes evident that the UK is undergoing a period of transformation. How well the Conservative Party can sustain its position, while examining the shifts in voting behaviour within the northern and southern regions of England, as well as among loyal Tory supporters is an important point of interest for all voters.
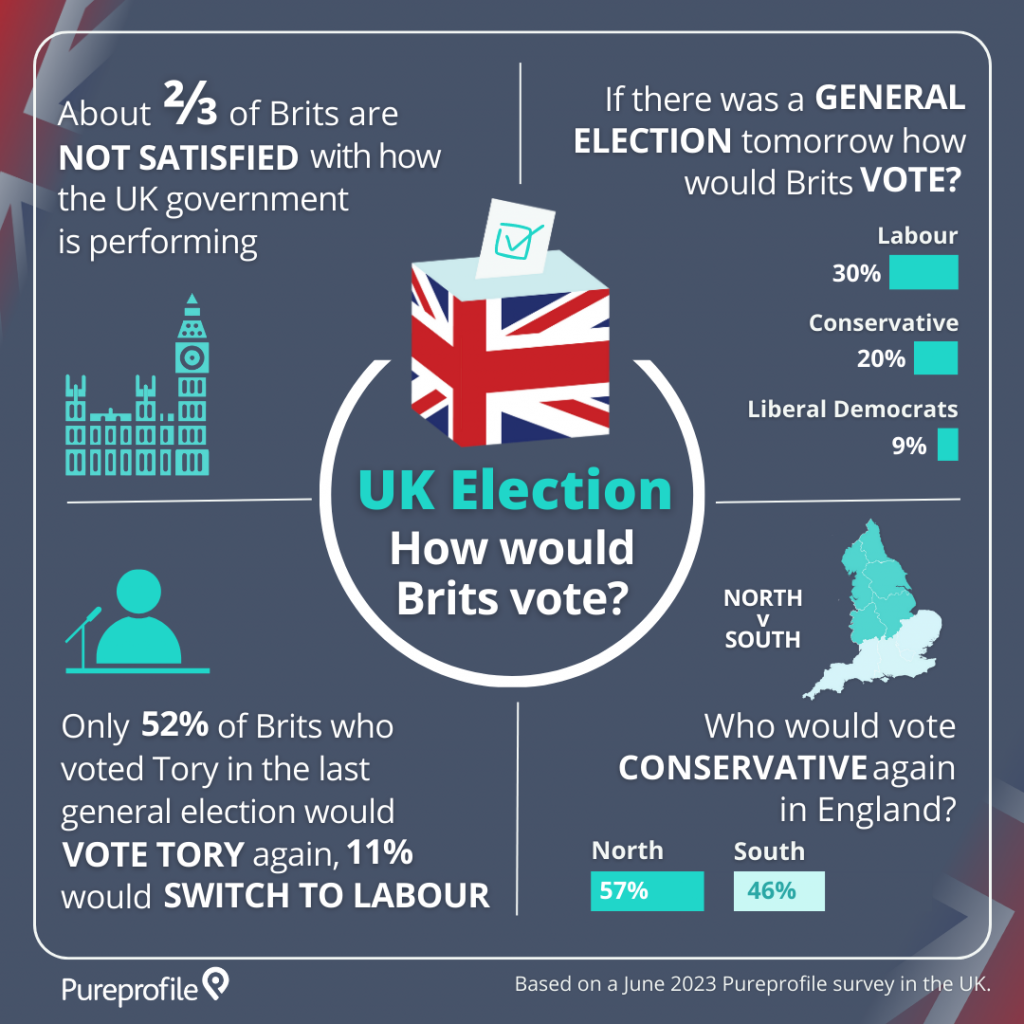
According to the findings of our recent survey, nearly 2/3 of the British population is dissatisfied with the performance of the UK government. This figure points to a considerable disparity between public expectations and the actual outcomes delivered by policymakers.
During the last general election, the Conservative Party secured the support of 44% of Brits who cast their votes, compared to 32% who voted Labour. Now four years on, only 20% of respondents indicate their support for the Conservative Party, with 30% of Brits expressing their willingness to vote Labour, marking a significant shift from the previous election results and the potential for dramatic political change.
Surprisingly, only 52% of Brits who voted for the Conservative Party in the last general election said they would remain loyal and vote Conservative again in the next election.
11% of those who voted Conservative in the last election would consider switching their allegiance to the Labour Party in the upcoming election.
The division between Northern and Southern voters has been a recurring theme in UK politics. While 57% of Northerners expressed their willingness to vote Conservative again, 46% of Southerners shared the same sentiment. This regional contrast is of significance given that constituents in the North had historically remained loyal to Labour, popularising the term ‘red wall’.
Despite an anticipated fall in votes for the upcoming election, the Scottish National Party continues to maintain its presence in Scotland, capturing 26% of votes compared to 36% achieved in the last general election.
Meanwhile, our survey findings shows that Northern Ireland votes would be split between the predominant Irish political parties: Democratic Unionist Party, Alliance Party and Sinn Féin, each garnering an equal share of 23% of the votes.
Based on a nationally representative sample of 500 Pureprofile panellists from the United Kingdom.
The infographic below represents the key findings from the research:


